How Cafeyn's tech team saves 100+ hours a month with Glazed
How Cafeyn's tech team saves 10+ hours per developer per month with visual tracking documentation. Zero alignment meetings, 50% fewer bugs, 31x ROI.
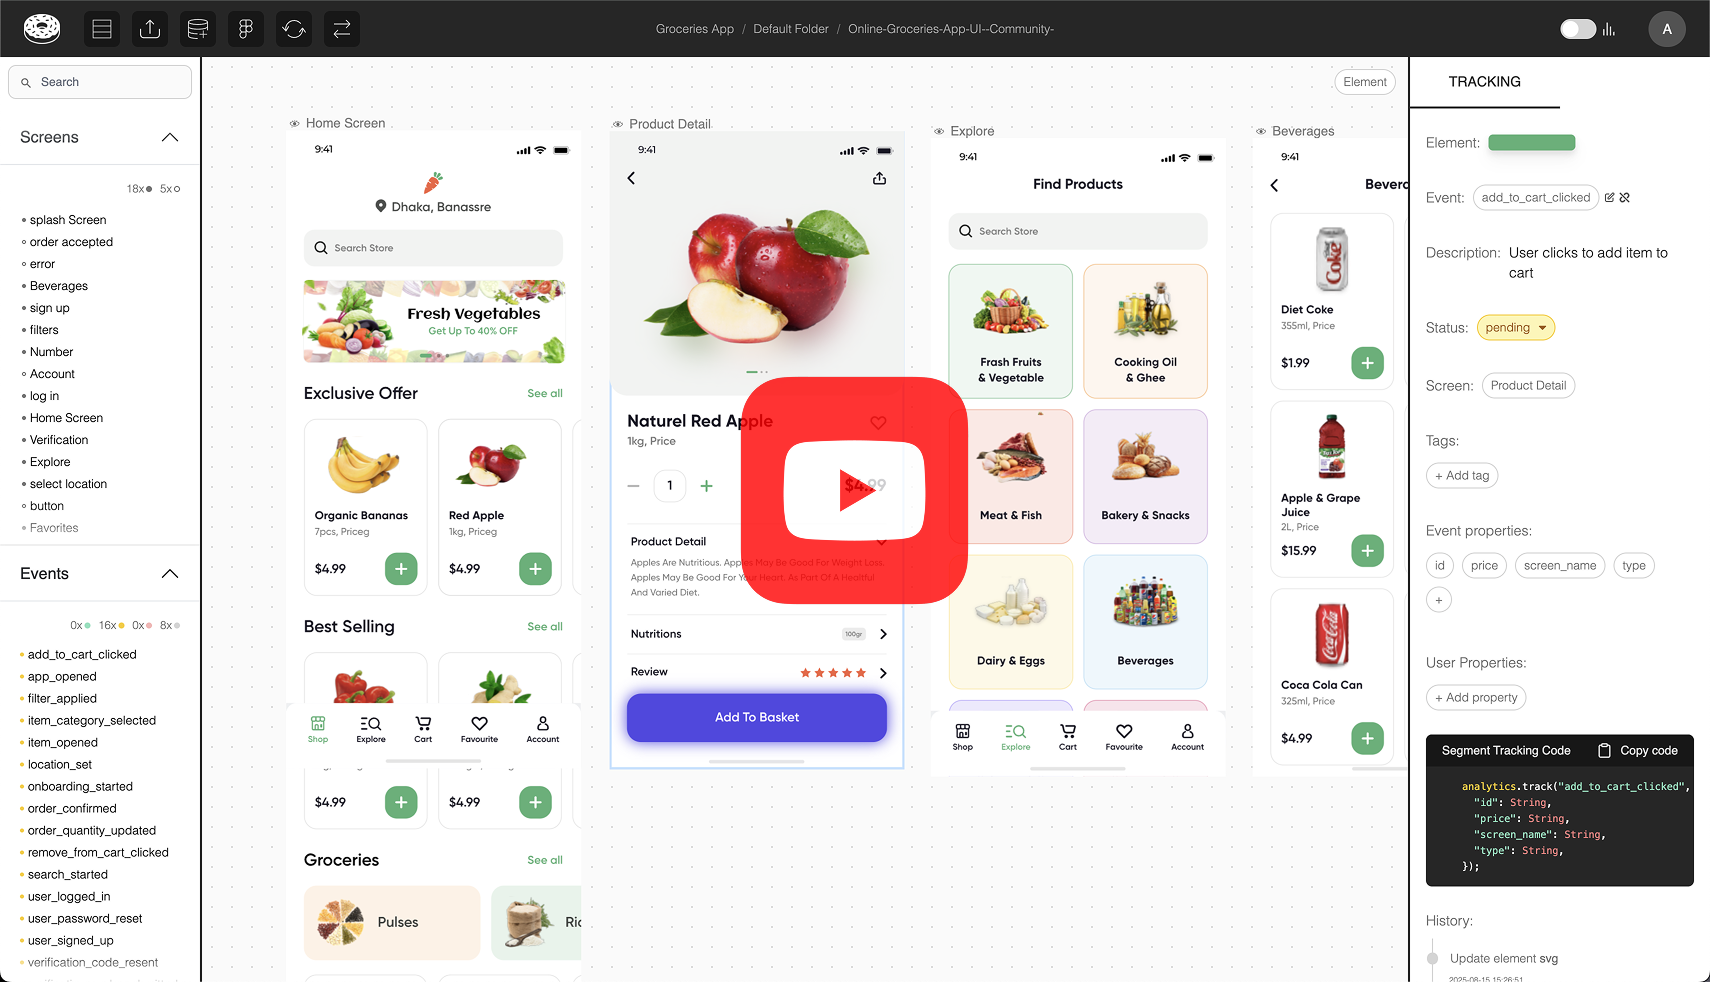
From Zero to Handoff-Ready Tracking Plans in <10min
New video series: We take real Figma Community projects and creating visual tracking plans with Glazed
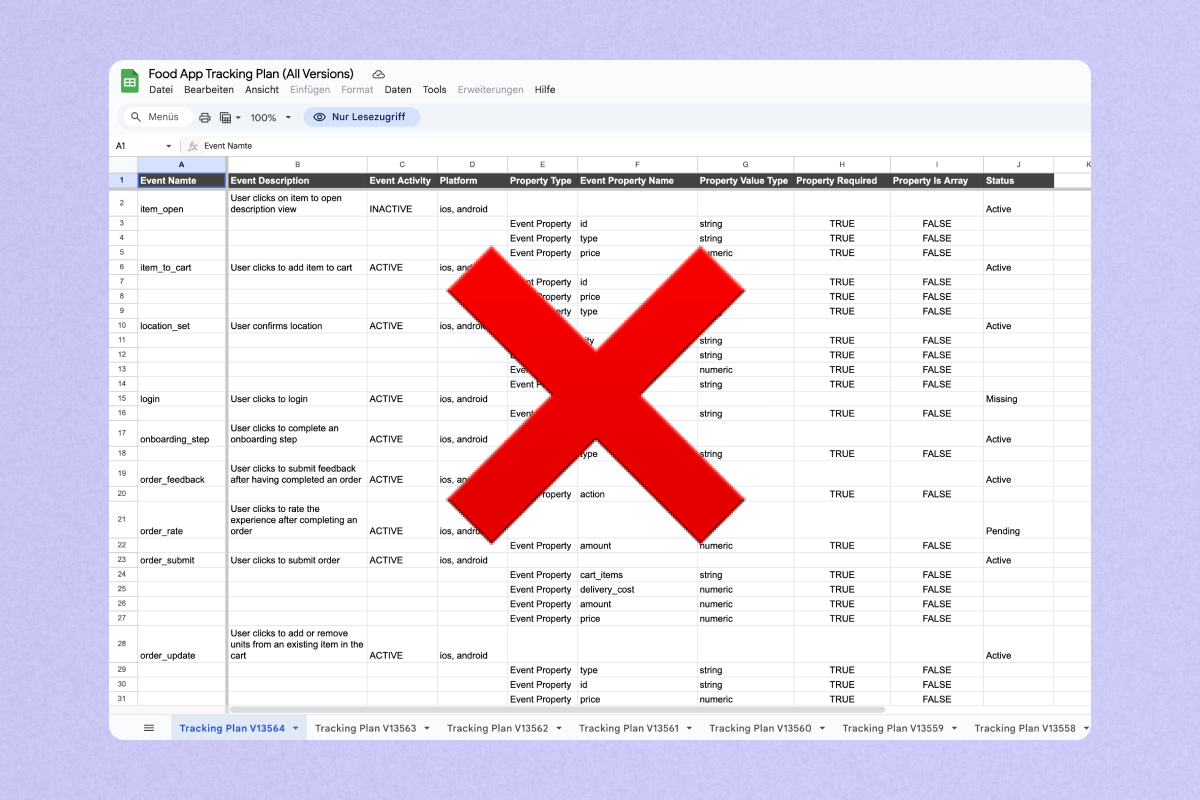
Ditch Your Spreadsheet: 7 Alternatives to the Tracking Spreadsheet
We get it. Spreadsheets have been the go-to since MySpace Tom was everyone's first friend...
How Amadeus unlocked 1 FTE of team productivity per sprint
How Amadeus stays ahead of the competition using Glazed by unlocking 48 hours of team productivity per sprint.
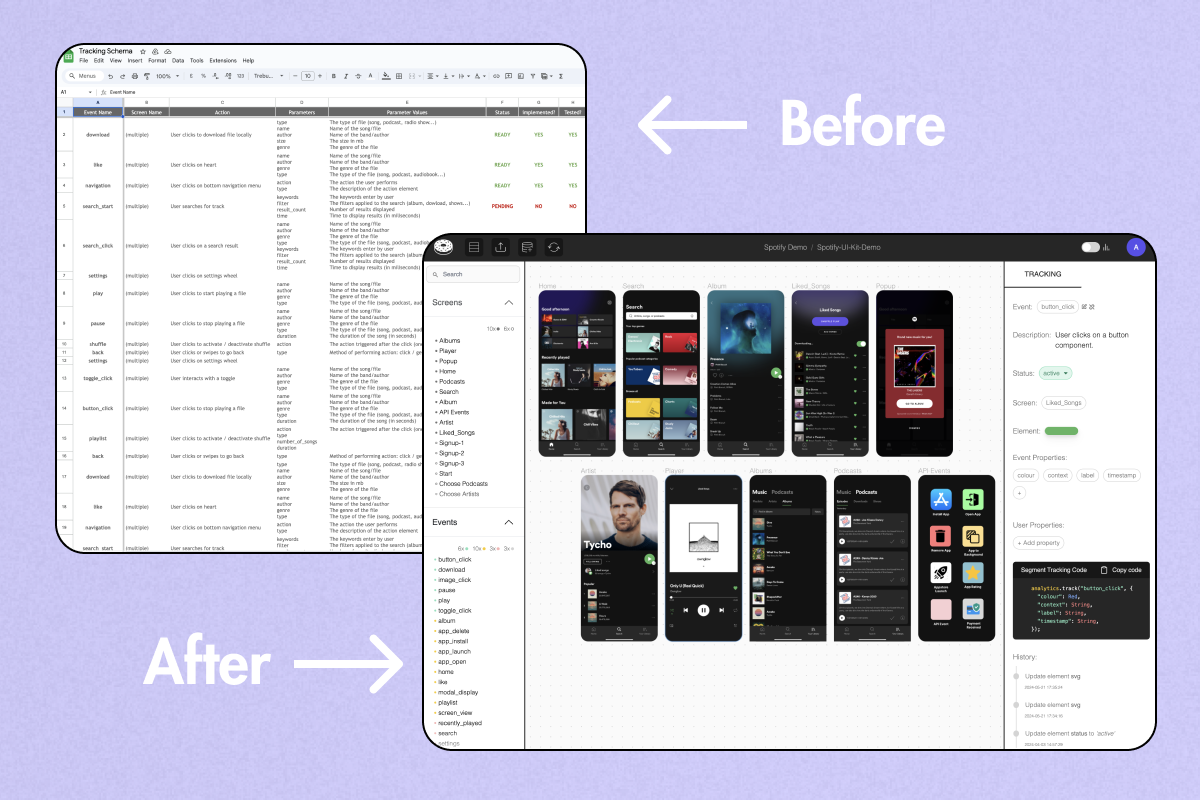
Why your tracking plan belongs in Figma
An invitation to replace your tracking spreadsheet with Glazed
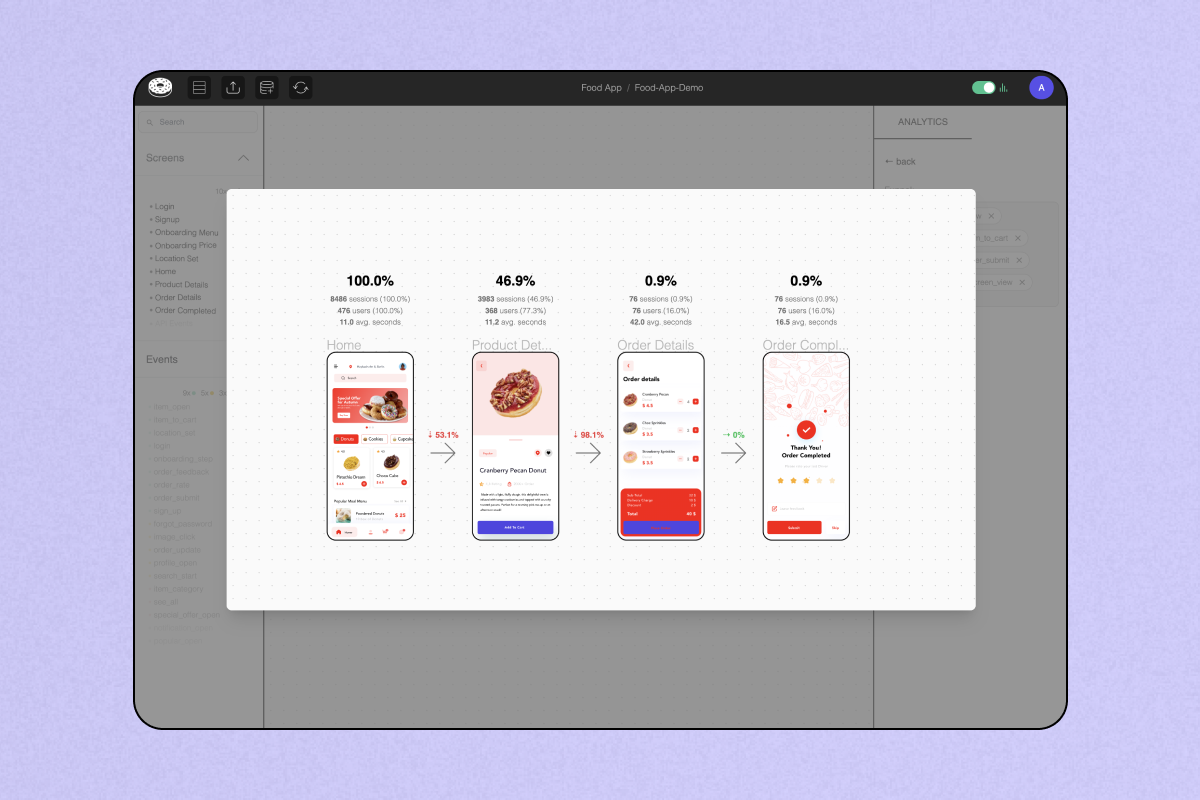
Intuitive Product Analytics Self-Service
Designers: see where your drop-offs take place, uncover unusual behaviour and optimise your conversion rates.
Better Data Collection with Glazed
Data teams: collect better data and streamline your tracking instrumentation in days, not weeks.

Introducing our Tracking Documentation Tool
The first visual tracking documentation tool that saves teams hundreds of hours per team on defining, instrumenting, monitoring and discovering product analytics events.